

Islanders are NHL's most unlucky team on the powerplay
The advanced stats suggest that the Islanders have been woefully unlucky this season and should have scored at least 8 more goals than the team has.

The New York Islanders have been the unluckiest team in the NHL when it comes to scoring on the Powerplay according to Expected Goals percentage from Moneypuck.
This surprised LowAttendance, and it may have surprised you. The Powerplay certainly isn’t what you’d describe as the strong suit for the Islanders.
At times this season, I’ve wondered why they don’t just try to play like it is 5v5 given how brutal the Powerplay has been.

And yet, the advanced stats say that actually the Islanders have been incredibly unlucky this season - which may bode well as the team chases a wildcard spot.
Trading for Bo Horvat probably will help in this area too, though you hope that some positive regression to the mean (as opposed to the negative regression that Dom L from the Athletic kept spouting about during the Conference championship runs) will occur.
Expected Goals definition
This article is based around advanced statistics sourced from Moneypuck. If you’re not comfortable with terms like Expected Goals1, Corsi2 and Fenwick3 you can read more about them following the links provided.
Expected Goals at 5 on 4
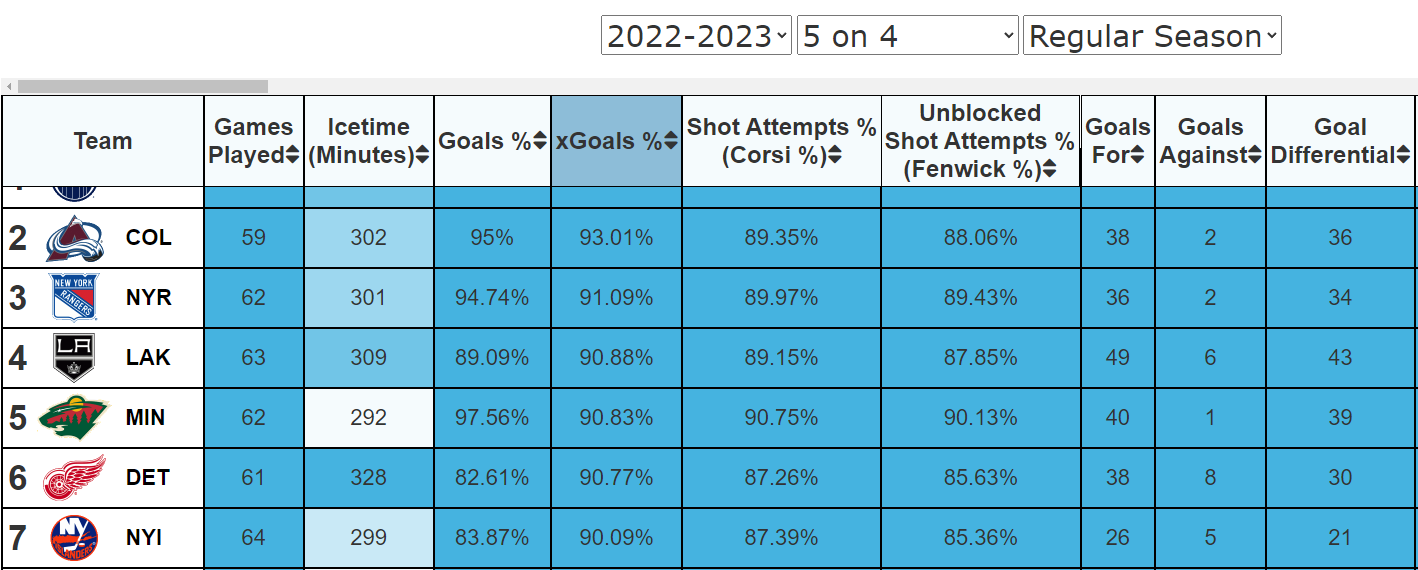
Seventh. That is where the Islanders rank in 5 on 4 Expected Goals % according to Moneypuck4 coming in at 90.09%.
Dead last is where the Islanders rank in actual goals while they have the Powerplay 26.
If you head over to Moneypuck and sort by Expected Goals %, it is a strange sight to see the Islanders amongst some of the league’s best Powerplays, such as Edmonton, which has 64 goals for so far this season. That’s more than double what the Islanders have scored.
The Expected Goals, based on the quality and quantity of shots, is 34.92 for the Islanders.
While Expected Goals is an abstract concept designed to measure performance while removing biases (see Moneyball5) and actual goals are what sends you to the Stanley Cup, it is somewhat comforting to understand these facts.
Just to continue down this thread of thought, if the Islanders had scored along with the statistical expectation, their Powerplay would be tied with Washington at 19th. By no means is that superb, but it is better than dead last in goals scored.
Goals Differential Above Expected
Now we turn to Goals Differential Above Expected (the difference between actual and Expected Goals) and we see that statistically speaking the Islanders have been the unluckiest team in the NHL on the Powerplay.
The number for the Islanders is -10.086 (Actual Goals scored (26) - Expected Goals (34.92) = Goals Differential Above Expected). The team ranks last in this category. Indeed, the gap (4.2) between the Islanders and San Jose (ranked 31st) is about the same as the gap (4.46) between San Jose and 22nd (New York Rangers). San Jose’s Goals Differential Above Expected is -5.88 and the Rags are at -1.84.
Last season, the Flyers had -10.07 Goals Differential Above Expected. Which means right now the Islanders are having a marginally worse season than one of the worst teams in the league from last year (and this one too). Unlike the Islanders, however, the Flyers had an Expected Goals % ranked 27th in the league.
Supporting metrics
There are many other metrics that support the notion that the Isles have been woefully unlucky this season.
For example, their Shooting Percentage on Unblocked Shots is 6.86% or dead last in the league.
The Faceoff Win percentage is 58.33% or 13th in the league.
Their Corsi % rank is 15th (87.39%) while their Fenwick % rank is 16th (85.36%).
The team ranks 18th in High Danger Shots For with 39 (the league leader is Florida with 63). Interestingly, the team has only surrendered 2 High Danger Shots Against all season.
This is where stats can be interesting because the so-called eye-test of LowAttendance has been the team has been very proficient at creating ways to lose games on the Powerplay. (However, it must be said that the team has 29 giveaways which is 9th in a stat where you want to be 32nd).
What next
At times this season it has been infuriating watching the Islanders Powerplay. There has been genuine excitement (and plenty of blunders too).
These stats suggest that the Islanders have been unlucky. The team has been generating good chances often enough that you would expect to see more goals scored.
The thing about Expected Goals is they are just that. Expected. What the Islanders need are actual goals on the Powerplay, and a lot more of them if the team wants to make the playoffs.
But it is comforting to know that as bad as the Powerplay has been, luck may have played a big factor in that and there may be brighter times ahead (also known as positive regression to the mean). Luck plays a big role in hockey7 and we can hope the Islanders have seen the worst of it for this season already.
https://www.moneypuck.com/glossary.htm
https://en.wikipedia.org/wiki/Corsi_(statistic)
https://en.wikipedia.org/wiki/Fenwick_(statistic)
https://www.moneypuck.com/teams.htm
https://en.wikipedia.org/wiki/Moneyball_(film)
https://www.moneypuck.com/teams.htm
https://www.vox.com/videos/2017/6/5/15740632/luck-skill-sports